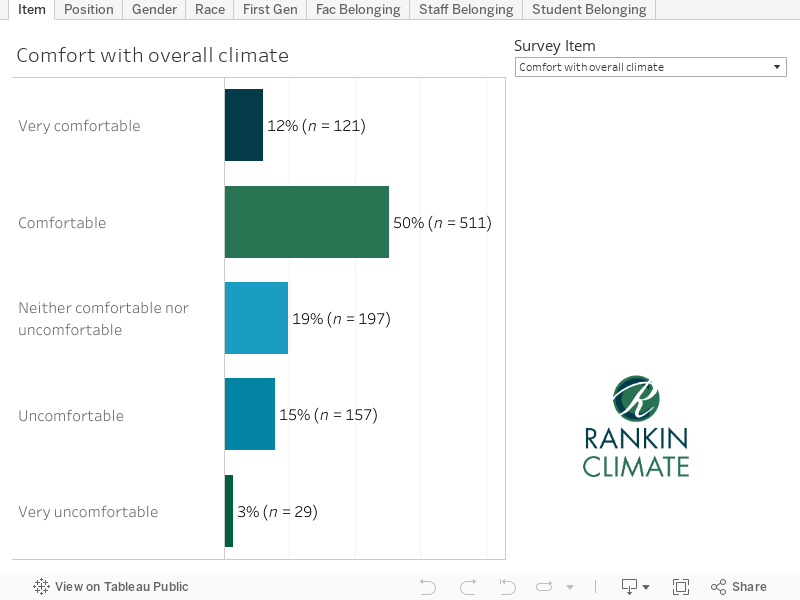
Rankin Climate utilizes cutting-edge data visualization tools to present information in compelling ways. We have expertise developing easy-to-use, interactive dashboards that are tailored to clients’ needs and allow them to explore a wide range of variables and relationships in the data. These products are designed with the purpose of enabling client to broaden their understanding of survey results and help facilitate data-driven decision making.
Our team possesses the expertise to compile data, conduct exploratory reviews, provide targeted analysis and generate key takeaways sensitive to client needs.